Distribute monthly sales forecast table files and how to set monthly sales budgets.
Monthly sales forecast
To analyze whether we want to invest in this shop or not, starting from creating the shop concept, setting a sales target that is not too high, in order to reach that goal, by analyzing step by step to analyze the monthly target. Let us know how much sales we have, how much costs, how much profit is left, is this investment worth it or not?
These figures come from market surveys, competitor surveys, and customer spending surveys to set sales targets so that employees can see how much income and sales they should make per day.
How to set a monthly sales budget
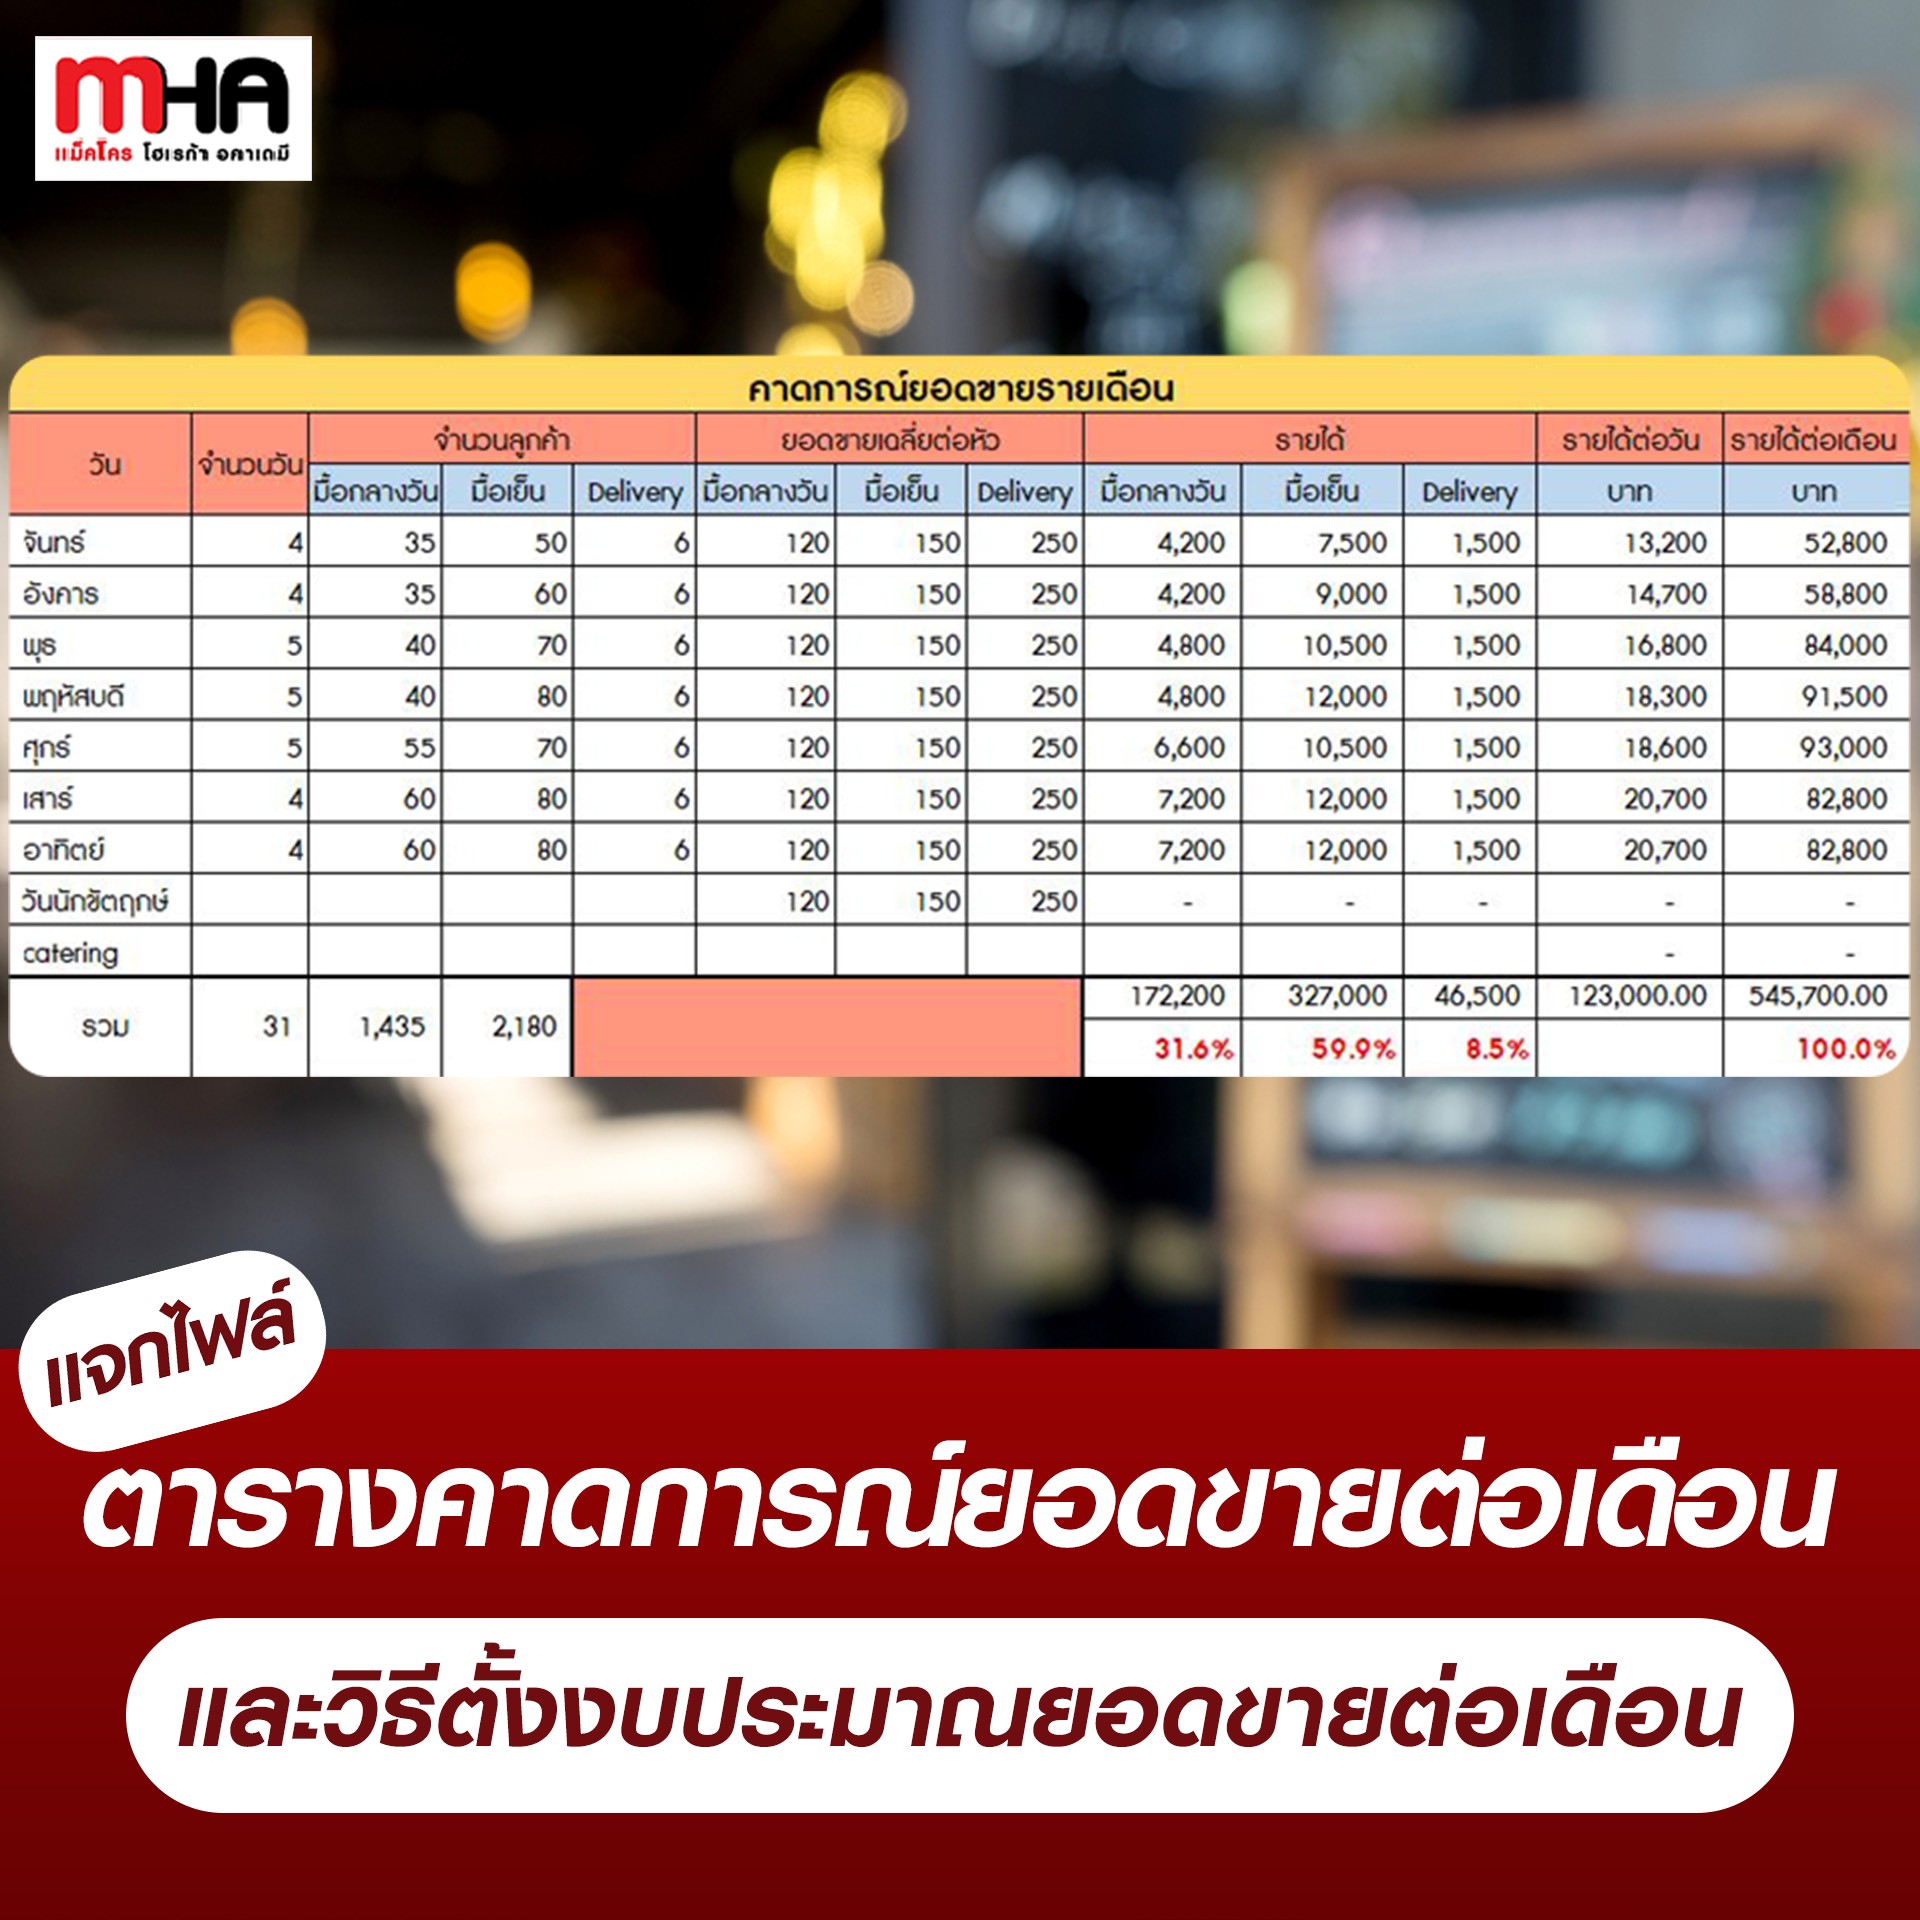
Column 1 – Day and number of days: In addition to Mon-Sun, there should be a field for public holidays because they may sell better than normal days to make it easier to set a sales budget. Column 2 – Number of customers, divided into lunch, dinner and delivery, may be derived from a general restaurant survey. Column 3 – Average sales per person for lunch, dinner and delivery. The figures can be estimated based on the price of the food we will sell. Column 4 – Enter lunch, dinner and delivery income. Formula: Lunch (Expected number of customers) x Average sales per person = Lunch revenue Column 5 – Daily Income Formula: Lunch + Dinner + Delivery = Daily Income Column 6 – Monthly income Formula: Daily income x Amount (eg. Monday) for the whole month = Estimated income (all Mondays combined)
Download free files at the course: Successful formula for analyzing sales to gain more profit than expected. Chapter 1 Setting a monthly sales budget: https://bit.ly/3JO66y8
Distribute daily sales record table files and methods for creating sales record tables.
How to create your own sales record table to analyze sales and determine strategies to increase sales.
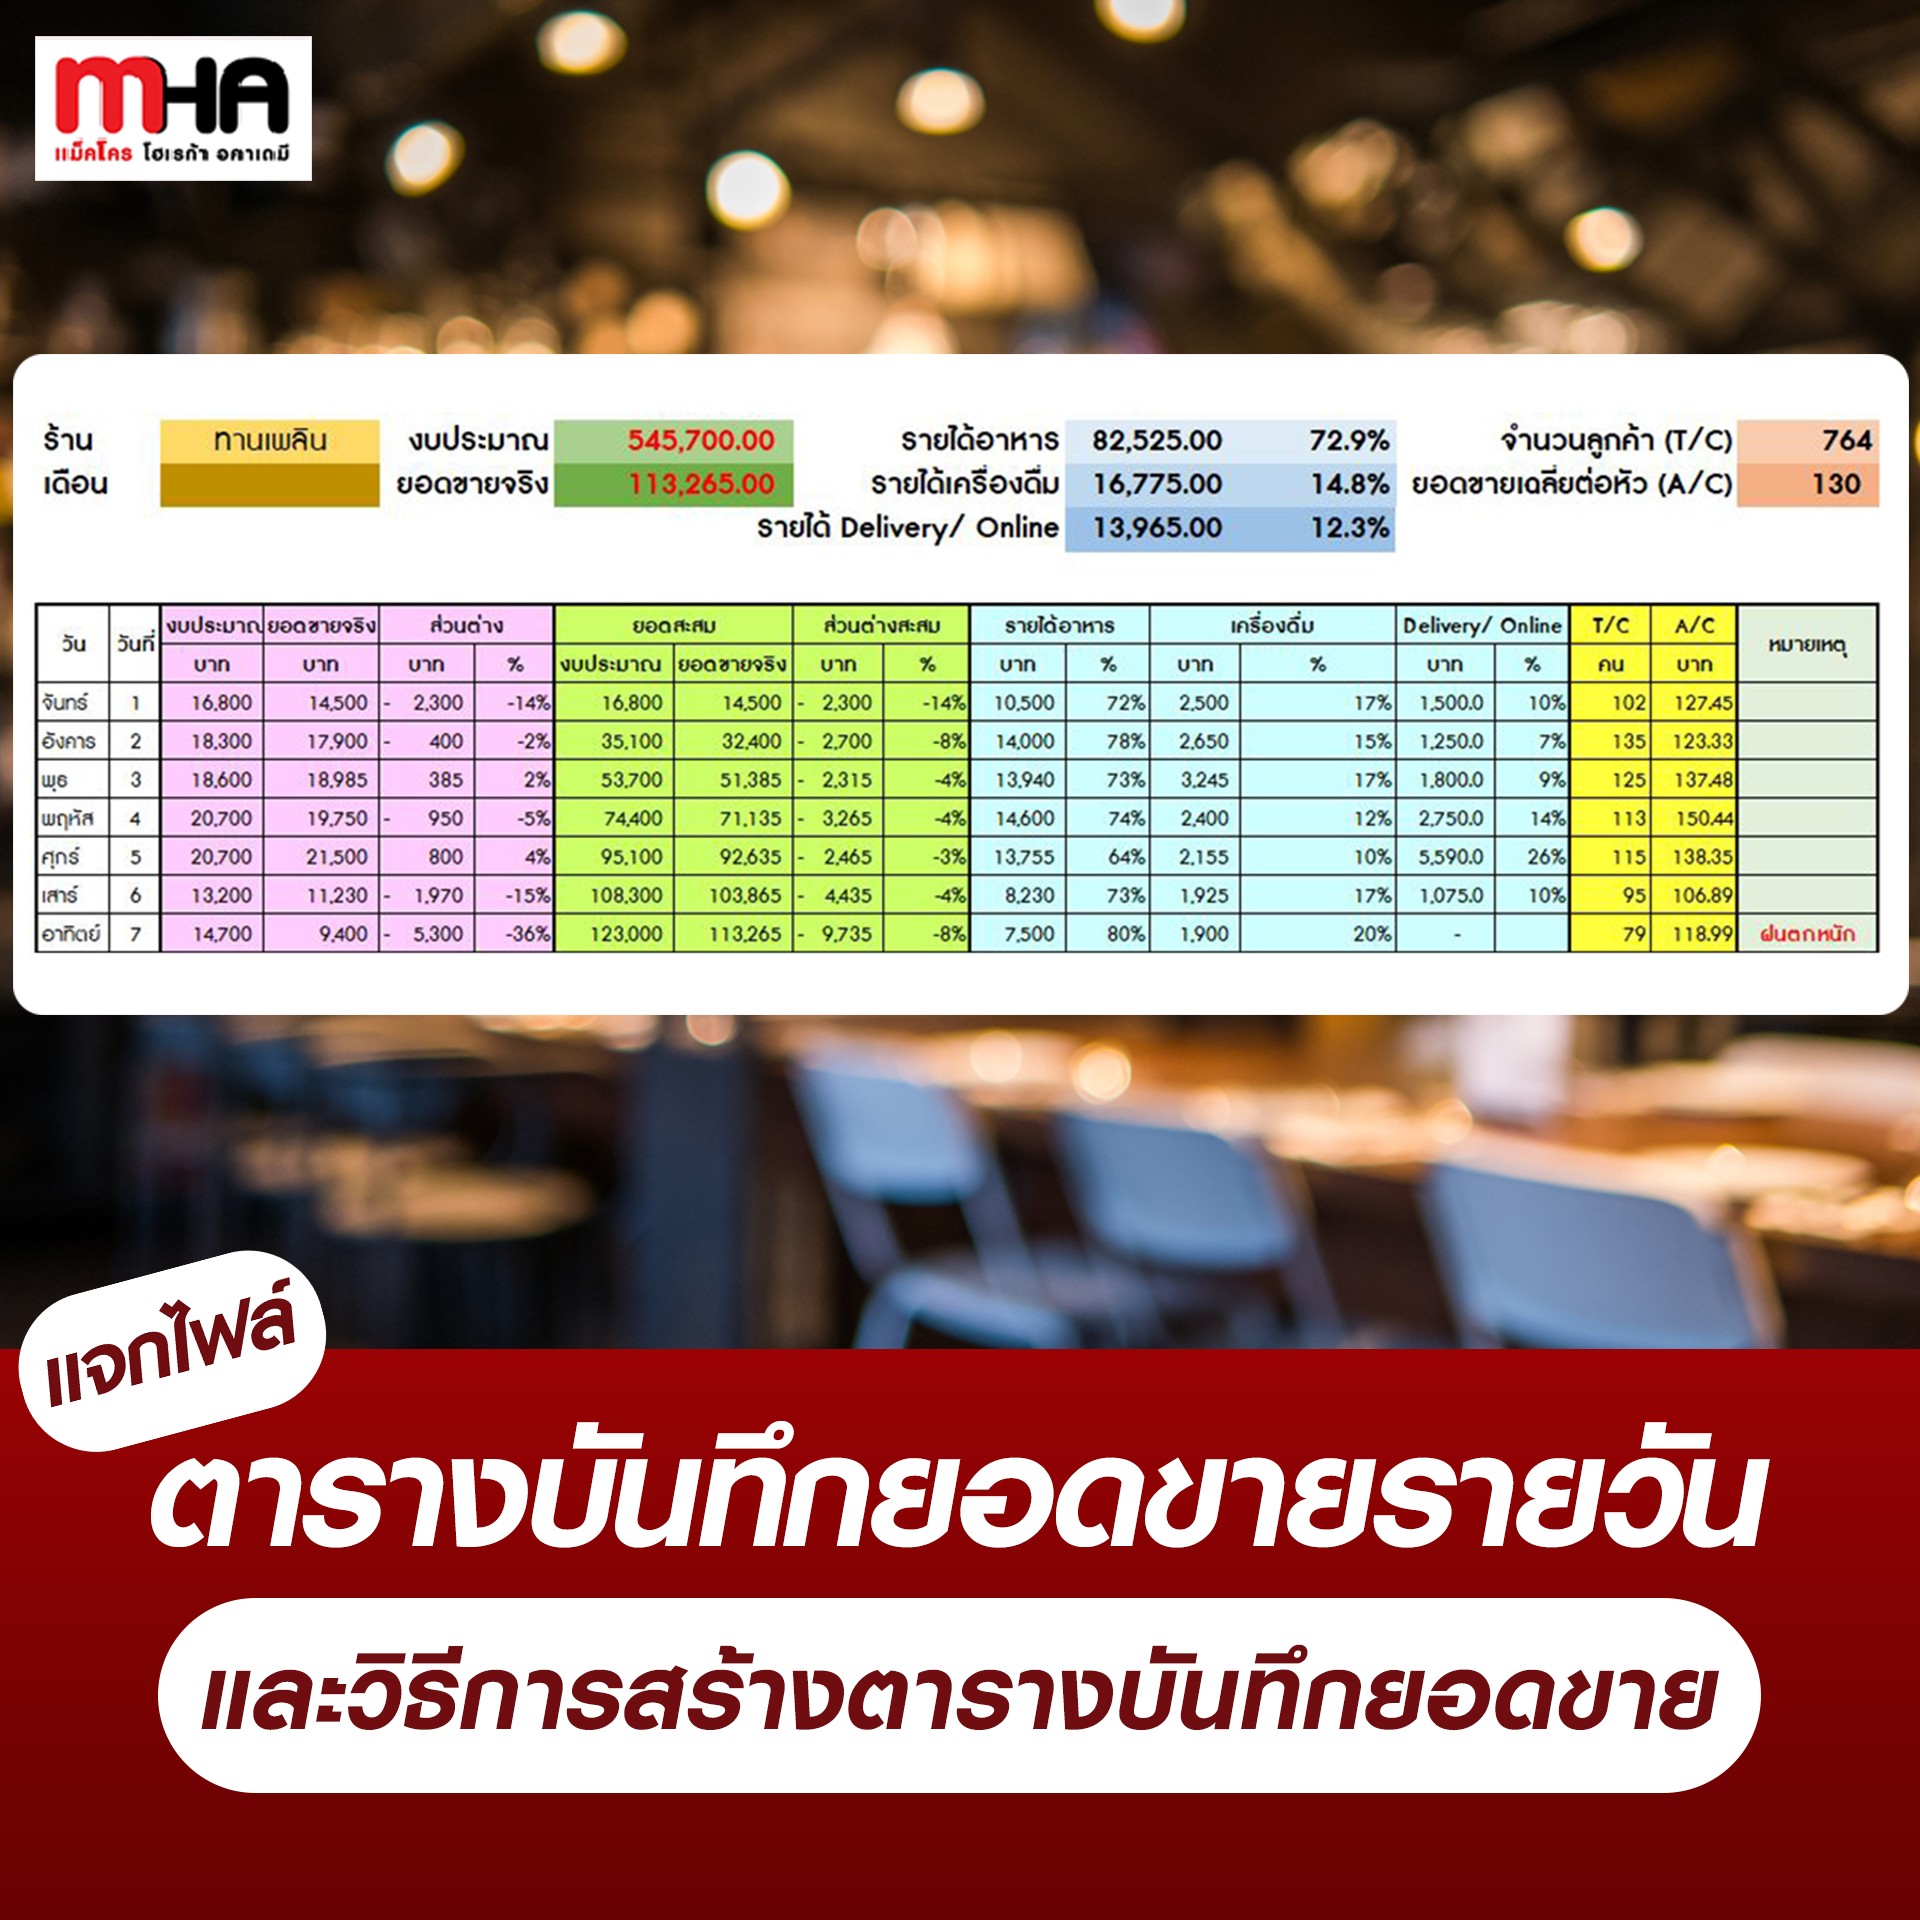
Column 1 – Day and number of days: In addition to Mon-Sun, there should be a field for public holidays because they may sell better than normal days to make it easier to set a sales budget.
Pink channel Column 2 – Budget: Fill in the monthly sales forecast budget (from the first table). And the actual sales column: by filling in the total sales for the whole day Column 3 – Difference: To see how much the budget differs from the actual sales.
Green channel Column 4 – Cumulative Total: Contains both budgeted totals and actual sales. Accumulated budget formula: Budget for day 1 + Budget for day 2 = Accumulated budget for 2 days Column 5 – Cumulative difference: To compare whether the actual sales and the expected sales are close to each other. What strategies do we need to adjust to achieve the sales target?
Blue channel Column 6 – Income: Includes income from food, beverages, Delivery/Online. To know where most of your revenue comes from, so you can adjust your strategy to better align with your customers’ needs.
Yellow channel Column 7 – T/C (Total Covers) is the number of customers using the service per day. The staff must record the actual number of customers using the service. Column 8 A/C (Average Check per Head) is the average sales per head that customers spend in our store per person by dividing the number of T/C by the actual sales that were sold on that day.
And we have to take the actual sales, subtract them from the Delivery/Online sales to get the actual sales, and divide them by the number of customers who come to use the service because we have no way of knowing how many customers who order through the Delivery/Online channel go to eat in order to get the real A/C (average sales per head that customers spend in our shop per person) data.
Column 9 – Note: You can enter both positive and negative information to help us know the reason for sales on that day.
Download free files at the course: Sales Analysis Formula to Get More Profit Than You Think Chapter 2 Sales Analysis to determine strategies to increase sales: https://bit.ly/3JO66y8
A formula for analyzing sales to generate more profit than expected
Take restaurant operators to analyze sales and add professional strategies.
- Learn how to set a sales budget. The course will simulate a restaurant to make it easier for you to understand. - Creating a monthly sales record table - Analyze to create strategies to increase sales per head - Increasing the number of customers - Increasing distribution channels How to adjust strategies to increase sales close to or in line with our set budget Just log in at the top right corner and you can study for free immediately! >> https://bit.ly/3JO66y8
Taught by Ms. Mathuros Wongpradu Director, PRCM Thailand and former Operation Director of a famous international brand